Summary of results #P128

Summary for Sample 1

Image 1

Total number of fibres found: 13
Density (number of fibres per cm2): 10
Fibre: 0.67x0.05mm, eccentricity: 1.00 Fibre: 0.38x0.09mm, eccentricity: 0.90 Fibre: 0.54x0.08mm, eccentricity: 0.94 Fibre: 0.45x0.09mm, eccentricity: 0.95 Fibre: 0.58x0.07mm, eccentricity: 0.98 Fibre: 0.80x0.07mm, eccentricity: 0.71 Fibre: 2.02x0.08mm, eccentricity: 0.94 Fibre: 0.48x0.07mm, eccentricity: 0.86 Fibre: 0.54x0.07mm, eccentricity: 0.98 Fibre: 0.61x0.06mm, eccentricity: 0.86 Fibre: 0.74x0.06mm, eccentricity: 0.77 Fibre: 0.96x0.08mm, eccentricity: 0.99 Fibre: 0.58x0.07mm, eccentricity: 0.92
Highlights - hover over regions to display their approximate size

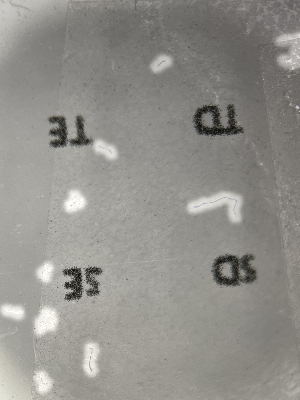
Highlighted areas show the fibres automatically detected. We will also count them by eye and learn how well the program is working.
The processing tool converts the image into a "segmented" image where the fibres detected are isolated and everything else is shown as white.
The size of the fibres is important because the smaller the fibre the more likely it is to be inhaled. The tool can automatically measure the length (and width, not shown) of each fibre. This chart is a histogram showing how many fibres were found in each size category.
The colour can help us identify where the fibre came from - for example blue and white is often from denim jeans. This figure shows the colour distribution of the fibres detected. Look around and see if the colours match any of the furnishings in the room.

Image 2

Total number of fibres found: 2
Density (number of fibres per cm2): 1
Fibre: 1.23x0.07mm, eccentricity: 0.98 Fibre: 0.95x0.09mm, eccentricity: 0.98
Highlights - hover over regions to display their approximate size

Highlighted areas show the fibres automatically detected. We will also count them by eye and learn how well the program is working.
The processing tool converts the image into a "segmented" image where the fibres detected are isolated and everything else is shown as white.
The size of the fibres is important because the smaller the fibre the more likely it is to be inhaled. The tool can automatically measure the length (and width, not shown) of each fibre. This chart is a histogram showing how many fibres were found in each size category.
The colour can help us identify where the fibre came from - for example blue and white is often from denim jeans. This figure shows the colour distribution of the fibres detected. Look around and see if the colours match any of the furnishings in the room.

Image 3

Total number of fibres found: 18
Density (number of fibres per cm2): 11
Fibre: 0.69x0.07mm, eccentricity: 0.85 Fibre: 0.80x0.06mm, eccentricity: 0.65 Fibre: 0.55x0.08mm, eccentricity: 0.94 Fibre: 0.65x0.07mm, eccentricity: 0.86 Fibre: 0.91x0.08mm, eccentricity: 0.93 Fibre: 0.76x0.06mm, eccentricity: 0.97 Fibre: 0.51x0.09mm, eccentricity: 0.93 Fibre: 0.47x0.09mm, eccentricity: 0.95 Fibre: 16.11x0.08mm, eccentricity: 0.89 Fibre: 1.42x0.09mm, eccentricity: 0.96 Fibre: 0.76x0.06mm, eccentricity: 0.79 Fibre: 2.29x0.09mm, eccentricity: 0.98 Fibre: 0.84x0.07mm, eccentricity: 0.98 Fibre: 0.65x0.06mm, eccentricity: 0.98 Fibre: 0.73x0.08mm, eccentricity: 0.99 Fibre: 1.27x0.09mm, eccentricity: 0.98 Fibre: 0.95x0.06mm, eccentricity: 0.71 Fibre: 0.44x0.11mm, eccentricity: 0.97
Highlights - hover over regions to display their approximate size

Highlighted areas show the fibres automatically detected. We will also count them by eye and learn how well the program is working.

The processing tool converts the image into a "segmented" image where the fibres detected are isolated and everything else is shown as white.
The size of the fibres is important because the smaller the fibre the more likely it is to be inhaled. The tool can automatically measure the length (and width, not shown) of each fibre. This chart is a histogram showing how many fibres were found in each size category.
The colour can help us identify where the fibre came from - for example blue and white is often from denim jeans. This figure shows the colour distribution of the fibres detected. Look around and see if the colours match any of the furnishings in the room.

Image 4

Total number of fibres found: 4
Density (number of fibres per cm2): 2
Fibre: 0.45x0.09mm, eccentricity: 0.95 Fibre: 3.17x0.11mm, eccentricity: 0.91 Fibre: 0.52x0.07mm, eccentricity: 0.91 Fibre: 0.87x0.11mm, eccentricity: 0.99
Highlights - hover over regions to display their approximate size

Highlighted areas show the fibres automatically detected. We will also count them by eye and learn how well the program is working.
The processing tool converts the image into a "segmented" image where the fibres detected are isolated and everything else is shown as white.
The size of the fibres is important because the smaller the fibre the more likely it is to be inhaled. The tool can automatically measure the length (and width, not shown) of each fibre. This chart is a histogram showing how many fibres were found in each size category.
The colour can help us identify where the fibre came from - for example blue and white is often from denim jeans. This figure shows the colour distribution of the fibres detected. Look around and see if the colours match any of the furnishings in the room.