Summary of results #P077
Summary for Sample 1
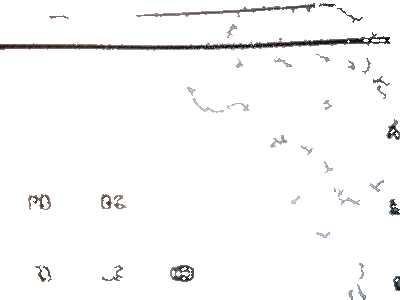
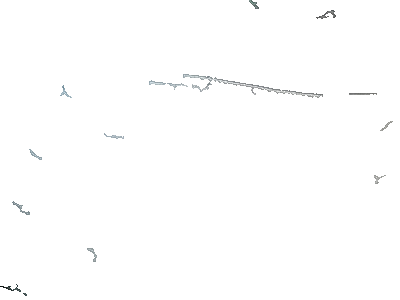
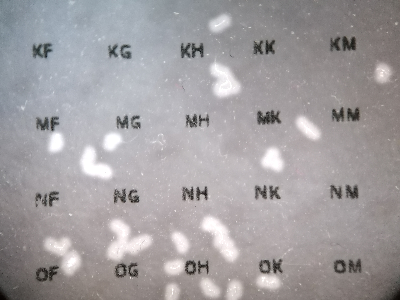
Image 1
| Total number of fibres found: | 5 |
|---|---|
| Density (number of fibres per cm2): | 0 |
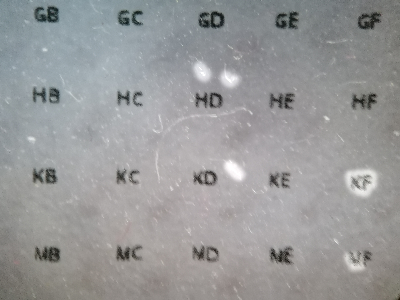
Highlighted areas show the fibres automatically detected. We will also count them by eye and learn how well the program is working.
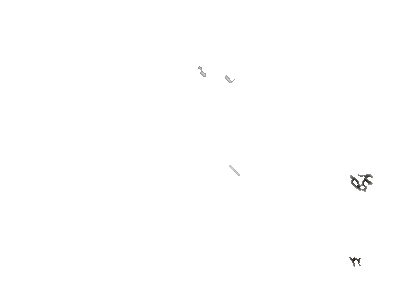

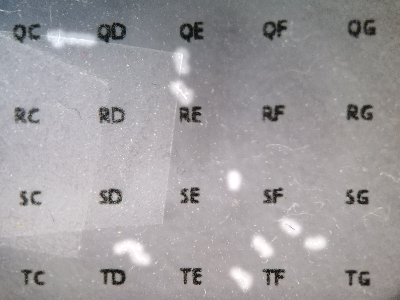
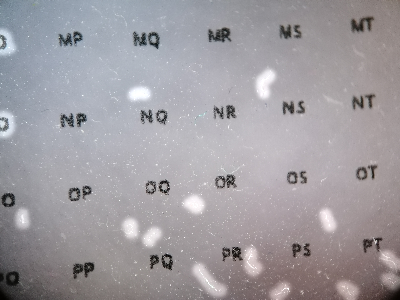
Image 2
| Total number of fibres found: | 15 |
|---|---|
| Density (number of fibres per cm2): | 0 |

Highlighted areas show the fibres automatically detected. We will also count them by eye and learn how well the program is working.
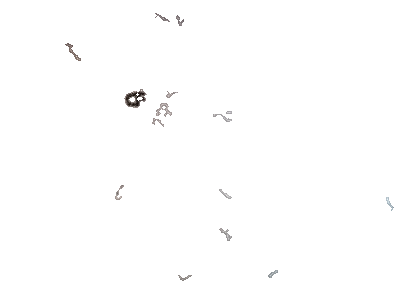

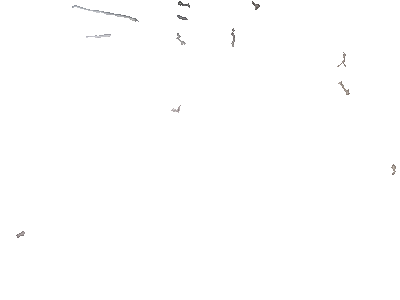
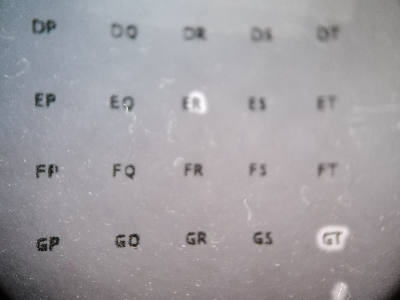
Image 3
| Total number of fibres found: | 12 |
|---|---|
| Density (number of fibres per cm2): | 0 |

Highlighted areas show the fibres automatically detected. We will also count them by eye and learn how well the program is working.


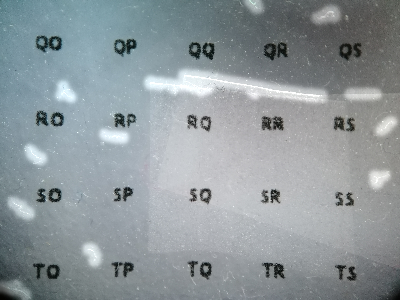
Image 4
| Total number of fibres found: | 38 |
|---|---|
| Density (number of fibres per cm2): | 0 |
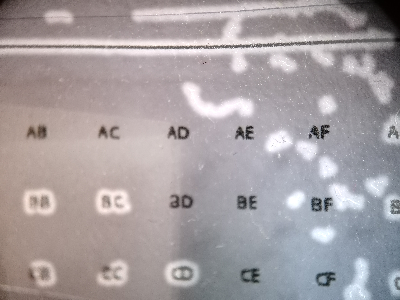
Highlighted areas show the fibres automatically detected. We will also count them by eye and learn how well the program is working.

Summary for Sample 2
Image 1
| Total number of fibres found: | 15 |
|---|---|
| Density (number of fibres per cm2): | 1 |

Highlighted areas show the fibres automatically detected. We will also count them by eye and learn how well the program is working.


Image 2
| Total number of fibres found: | 10 |
|---|---|
| Density (number of fibres per cm2): | 0 |
Highlighted areas show the fibres automatically detected. We will also count them by eye and learn how well the program is working.


Image 3
| Total number of fibres found: | 12 |
|---|---|
| Density (number of fibres per cm2): | 0 |

Highlighted areas show the fibres automatically detected. We will also count them by eye and learn how well the program is working.

Summary for Sample 5
Image 1
| Total number of fibres found: | 14 |
|---|---|
| Density (number of fibres per cm2): | 0 |
Highlighted areas show the fibres automatically detected. We will also count them by eye and learn how well the program is working.

Summary for Sample 6
Image 1
| Total number of fibres found: | 16 |
|---|---|
| Density (number of fibres per cm2): | 0 |
Highlighted areas show the fibres automatically detected. We will also count them by eye and learn how well the program is working.


Image 2
| Total number of fibres found: | 4 |
|---|---|
| Density (number of fibres per cm2): | 0 |
Highlighted areas show the fibres automatically detected. We will also count them by eye and learn how well the program is working.
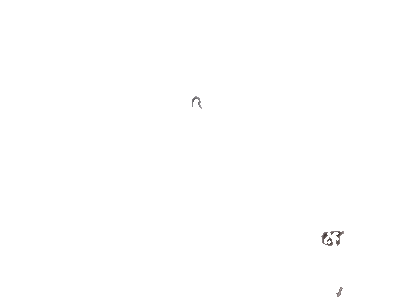

Image 3
| Total number of fibres found: | 21 |
|---|---|
| Density (number of fibres per cm2): | 0 |
Highlighted areas show the fibres automatically detected. We will also count them by eye and learn how well the program is working.
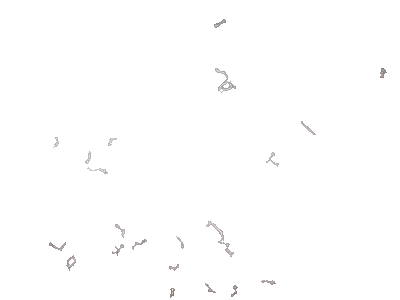

Image 4
| Total number of fibres found: | 23 |
|---|---|
| Density (number of fibres per cm2): | 0 |

Highlighted areas show the fibres automatically detected. We will also count them by eye and learn how well the program is working.

